News Warum ich mich gerade jetzt selbstständig mache Trotz dem aktuellen KI-Hype ist das Potenzial für Automation im Journalismus noch weitgehend ungenutzt. Künftig möchte ich Medienunternehmen dabei unterstützen.
Projects Von Prototyp zu Produktion: Wie wir bei Tamedia generative KI einführen In welcher Phase des KI-Hypecycles sind wir gerade? Zeit, eine Zwischenbilanz anhand eines konkreten Beispiels zu ziehen.
Projects Vom Papier zur digitalen Plattform: Wie wir amtliche Meldungen automatisch weiterveröffentlichen Die Digitalisierung von Amtsblättern und Gemeinde-Meldungen geht schnell voran. Mittels offener Schnittstellen können wir diese nun auch journalistisch weiterverwenden – vollautomatisch und ohne redaktionellen Zusatzaufwand.
Projects «Automated journalism» at scale Learn how we've built an automated system to craft personalized, municipality-specific stories, boosting reader engagement one article at a time.
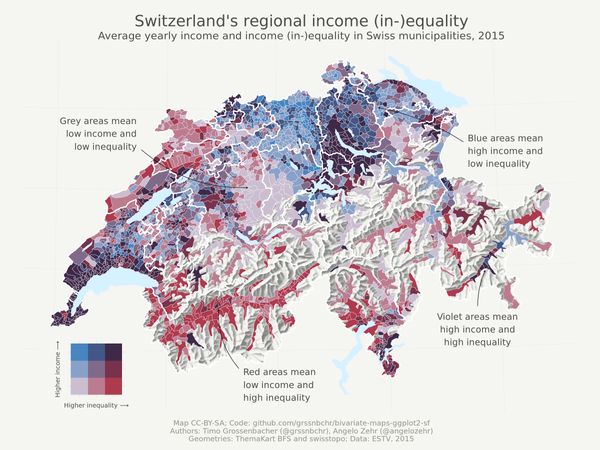
Tutorials Bivariate maps with ggplot2 and sf This post guides you through creating a beautiful, bivariate thematic map using solely two R packages, ggplot2 and sf.
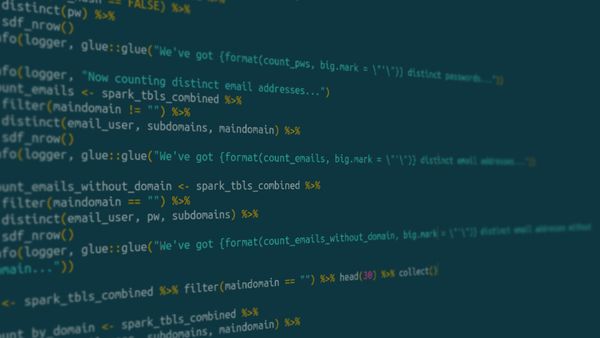
Tutorials (Big) Data Journalism with Spark and R This post shows how to process gigabytes of unstructured data with the Spark framework and using the R language.
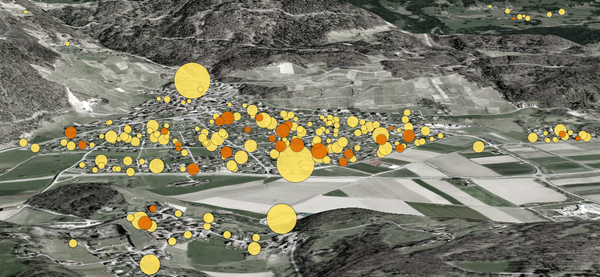
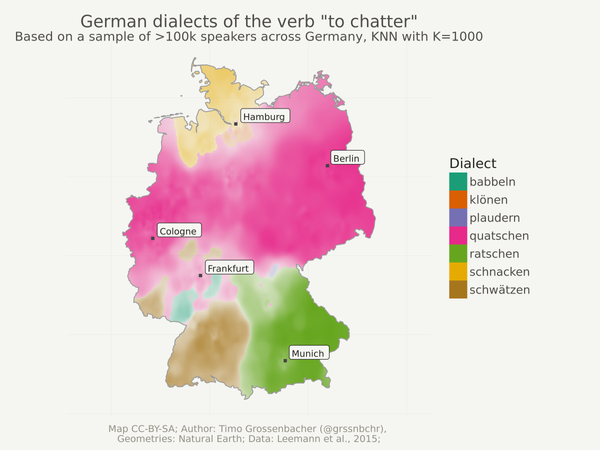
Tutorials Categorical spatial interpolation with R In this blog post, I show how to easily produce a categorical spatial interpolation from a set of georeferenced points – only using the tidyverse, sf and the package kknn.